DP-Bind is a web server for sequence-based prediction of DNA-binding residues in proteins that bind double-stranded DNA. DP-Bind implements three machine learning methods: support vector machine (SVM), kernel logistic regression (KLR), and penalized logistic regression (PLR). These methods were trained on a non-redundant dataset of 62 experimentally determined structures of protein-dsDNA complexes. Prediction can be performed using either the input sequence alone or a profile of evolutionary conservation of the input sequence in the form of PSI-BLAST position-specific scoring matrix (PSSM) automatically generated by the web-server. The outputs of all three individual methods are combined into a consensus prediction to help identify positions predicted with high level of confidence. DP-Bind reports two consensus predictions. One is majority consensus obtained by majority voting. For instance, if two methods predict a given position as 'DNA-binding' and the third predicts it as 'non-binding', the majority consensus label is 'DNA-binding'. The other is strict consensus obtained by unanimous agreement. For instance, if one method disagrees with the other two, no consensus label is assigned to a given sequence position (denoted N/A). Thus, the strict consensus retains only a sub-set of high confidence predictions on which all three methods agree.
The average performance of predictors that utilize evolutionary informationPredictor |
Accuracy |
Sensitivity |
Specificity |
|
pssm-SVM |
76.0% +/- 9.1 |
76.9% +/- 18.6 |
74.8% +/- 12.5 |
|
pssm-KLR |
77.2% +/- 9.3 |
76.4% +/- 18.5 |
76.6% +/- 11.2 |
|
pssm-PLR |
73.0% +/- 8.8 |
73.3% +/- 18.4 |
71.8% +/- 12.8 |
|
Majority consensus |
76.4% +/- 9.0 |
76.9% +/- 18.6 |
75.3% +/- 12.0 |
|
Strict consensus* |
80.0% +/- 9.4 |
79.1% +/- 19.4 |
78.6% +/- 12.7 |
|
Predictor |
Accuracy |
Sensitivity |
Specificity |
|
seq-SVM |
68.2% +/- 6.6 |
70.4% +/- 16.5 |
66.8% +/- 9.2 |
|
seq-KLR |
68.6% +/- 5.5 |
66.8% +/- 15.4 |
68.9% +/- 7.8 |
|
seq-PLR |
67.8% +/- 6.9 |
69.0% +/- 13.3 |
67.0% +/- 9.0 |
|
Majority consensus |
69.1% +/- 6.2 |
69.9% +/- 16.1 |
68.2% +/- 8.6 |
|
Strict consensus* |
72.2% +/- 7.2 |
73.1% +/- 16.3 |
71.4% +/- 9.8 |
*Please note that in the strict consensus some sequence positions are not assigned a label when one of the prediction methods disagrees with the other two. As a result, the total number of residues used to assess the performance of the strict consensus is usually smaller than that used to assess the performance of the individual methods and the majority consensus. See Hwang et al (2007) for details.
For more details on performance evaluation, comparison to other methods for predicting DNA-binding sites, and how our predictors perform on proteins from particular structural classes please refer to the Supplementary Information.
More information on the three prediction algorithms can be found in the following references:
>1A02:F C-FOS
MKRRIRRERNKMAAAKSRNRRRELTDTLQAETDQLEDEKSALQTEIANLLKEKEKL
>1A74:A INTRON-ENCODED ENDONUCLEASE I-PPOI
MALTNAQILAVIDSWEETVGQFPVITHHVPLGGGLQGTLHCYEIPLAAPYGVGFAKNGPT
RWQYKRTINQVVHRWGSHTVPFLLEPDNINGKTCTASHLCHNTRCHNPLHLCWESLDDNK
GRNWCPGPNGGCVHAVVCLRQGPLYGPGATVAGPQQRGSHFVV
>seq1
qilavidsweetvgqfpvithhvplggglqgtlhcyeiplaapygvgfakngpt
>
INQVVHRWGSHTVPFLLEPDNINGKTCTASHLCHNTRCHNPLHLCWESLDDNK
>1A02:F C-FOSIf you have a raw sequence that consists of sequence string alone, without a FASTA header line, just add a header line consisting of either:
twenty characters for twenty amino acids;Under sequence-based encoding, this web server treats B and Z as if they were Aspartate (D) and Glutamate (E), respectively. For PSSM-based encoding, no such conversion by the web server was necessary.A Alanine M Methionine C Cysteine N Asparagine D Aspartate P Proline E Glutamate Q Glutamine F Phenylalanine R Arginine G Glycine S Serine H Histidine T Threonine I Isoleucine V Valine K Lysine W Tryptophan L Leucine Y Tyrosineand the following three characters;B Aspartate or Asparagine Z Glutamate or Glutamine X UnknownThese one-letter codes can be in either upper-case or lower-case.
(5, -4, -3, -4, -3, -3, -3, -2, -4, -4, -3, -2, -4, -4, -4, 4, -2, -5, 2, -3)Each entry in this vector is scaled between 0 and 1 using a logistic function to produce a normalized vector:
(0.9933, 0.0180, 0.0474, 0.0180, 0.0474, 0.0474, 0.0474, 0.1192, 0.0180, 0.0180, 0.0474, 0.1192, 0.0180, 0.0180, 0.0180, 0.9820, 0.1192, 0.0067, 0.8808, 0.0474)
(4, 0, -2, -1, -2, 0, -2, -1, -1, -1, -1, -2, -1, -1, -1, 1, 0, 0, -3, -2)Each entry in this vector is scaled between 0 and 1 using a logistic function to give rise to a normalized vector:
(0.9820, 0.5000, 0.1192, 0.2689, 0.1192, 0.5000, 0.1192, 0.2689, 0.2689, 0.2689, 0.2689, 0.1192, 0.2689, 0.2689, 0.2689, 0.7311, 0.5000, 0.5000, 0.0474, 0.1192)
(1, 0, 0, 0, 0, 0, 0, 0, 0, 0, 0, 0, 0, 0, 0, 0, 0, 0, 0, 0)
Figure 1 shows a sample
prediction result that consists of three parts. Part 1 describes the output
format itself. Part 2 shows the submitted sequence in FASTA format. Part 3 shows
the results of the prediction.
Labels in columns S_LBL, K_LBL, and P_LBL correspond to
binding labels predicted by the three
prediction methods: Support Vector Machine (SVM), Kernel Logistic Regression
(KLR), and Penalized Logistic Regression (PLR), respectively. The
labels 1 and 0 stand for DNA-binding and non-binding residue,
respectively.
Binding labels in columns MAJ_CON and STR_CON show the consensus predictions:
1) MAJ_CON is the majority consensus label obtained by the majority vote of the three labels in columns S_LBL, K_LBL, and P_LBL (i.e., MAJ_CON is the label predicted by at least two methods).
2) STR_CON is the
strict consensus label obtained by a unanimous agreement of the three labels in columns S_LBL, K_LBL, and P_LBL. If one of the three labels in S_LBL, K_LBL, P_LBL is different from the other two, the
strict consensus is not assigned (NA).
Columns S_PRB, K_PRB, and P_PRB show the probabilities of the predicted labels. These probabilities are in range [0.5 to 1.0]. The higher the probability, the greater the confidence of the predicted label. A probability close to 0.5 indicates a low-confidence prediction.
We suggest using the majority consensus as a default method. If the user wishes to use an individual method, we suggest using either KLR classifier or SVM classifier that show the highest average accuracy. The strict
consensus should be used as a supplement to identify residues
predicted with high confidence.
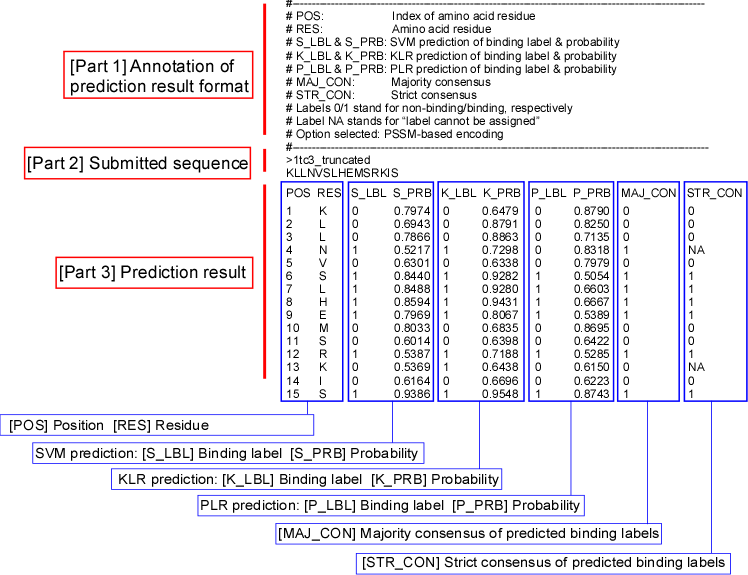
Figure 1. A
sample prediction result, consisting of three parts: [Part 1] a header
describing its format, [Part 2] submitted FASTA sequence, and [Part 3] a
prediction result in a columnar format. The result was truncated to fit the
page.
The expected wait time depends
on the encoding method and the number of previously submitted jobs in the queue. The PSSM encoding can take 5 to 10 (or even more) minutes per sequence. Please use 'Check the status of the job queue' link at the top of the input form to see the estimated wait time (this is a very rough estimate).
If you do not receive results within 48 hours, please contact Igor Kuznetsov.
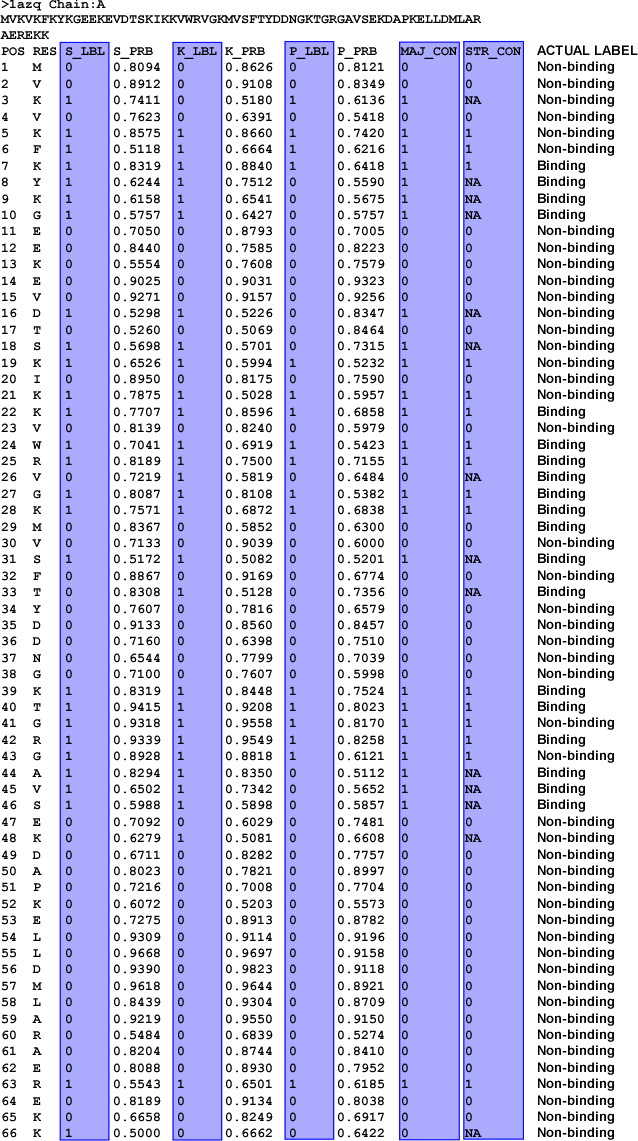
The following performance measures can be obtained for 1AZQ:A
| Encoding | Predictors | Accuracy | Sensitivity | Specificity |
|---|---|---|---|---|
| Sequence-based BLOSUM62 | Support Vector Machine | 77.3% | 84.2% | 74.5% |
| Kernel Logistic Regression | 75.8% | 84.2% | 72.3% | |
| Penalized Logistic Regression | 71.2% | 73.7% | 70.2% | |
| Majority Consensus | 78.8% | 84.2% | 76.6% | |
| *Strict Consensus | 78.9% | 86.7% | 75.7% | |
| PSSM-based | Support Vector Machine | 78.8% | 84.2% | 76.6% |
| Kernel Logistic Regression | 83.3% | 94.7% | 78.7% | |
| Penalized Logistic Regression | 72.7% | 47.4% | 83.0% | |
| Majority Consensus | 80.3% | 84.2% | 78.7% | |
| *Strict Consensus | 84.6% | 90.0% | 83.3% |
Figure 2. BLOSUM62-based Web
prediction for protein chain 1AZQ:A, along with actual binding labels appended.
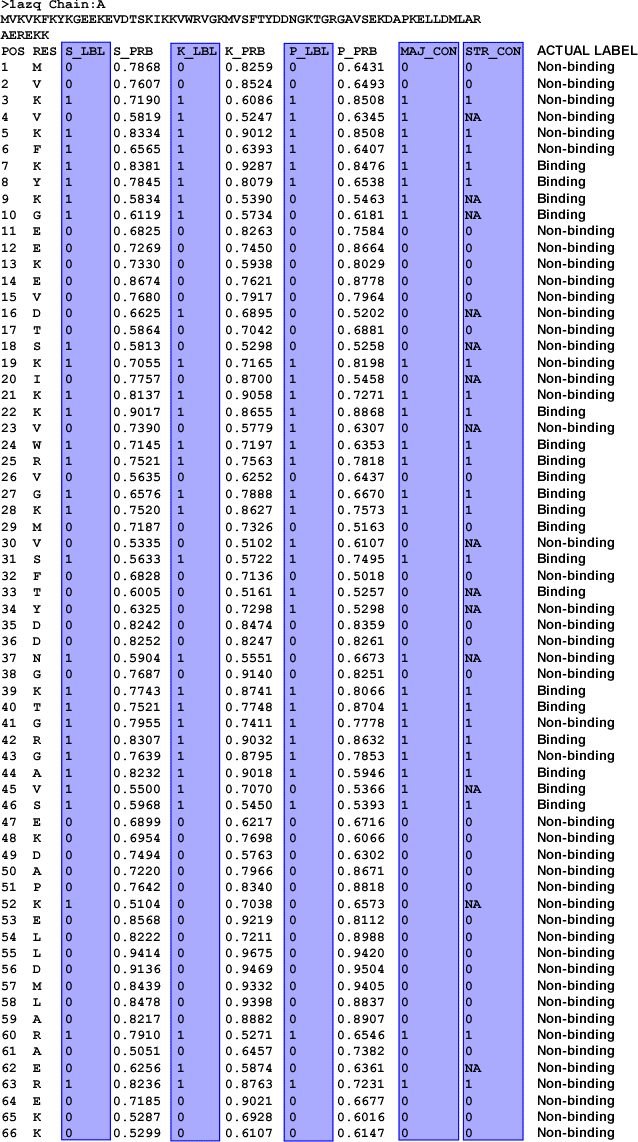
Figure 3. PSSM-based Web prediction for protein chain
1AZQ:A, along with actual binding labels appended.
If you use this web-server, please cite the following articles:
For more info please refer to the Supplementary Information.